Analisa teknikal mempunyai 3 prinsip dasar pemikiran:
1. Market Price Discount Everything
Iaitu harga yang tercermin dari chart atau grafik telah menggambarkan semua faktor yang mempengaruhi pasar.
2. Price Moves in Trend
Iaitu pergerakan harga tidak bergerak secara acak melainkan berlangsung dalam satu pola (trend) tertentu dan akan terus berlangsung sampai ada tanda-tanda bahwa pola pergerakan ini berhenti dan berbalik arah.
3. History Repeats it Selfs
Iaitu ada kecenderungan kuat bahwa perilaku para investor dan pelaku pasar di masa lalu adalah sama dengan masa kini dalam menyikapi berbagai informasi yang mempengaruhi pasar.
Grafik (Chart)
Pemakaian grafik atau chart adalah hal yang paling penting dalam analisis teknikal karena satu-satunya objek analisa teknikal adalah pergerakan harga yang dapat dilihat dari chart.
Beberapa jenis chart yang sering dipakai dalam analisis teknikal adalah sebagai berikut:
1. Line Chart

2. Bar Chart
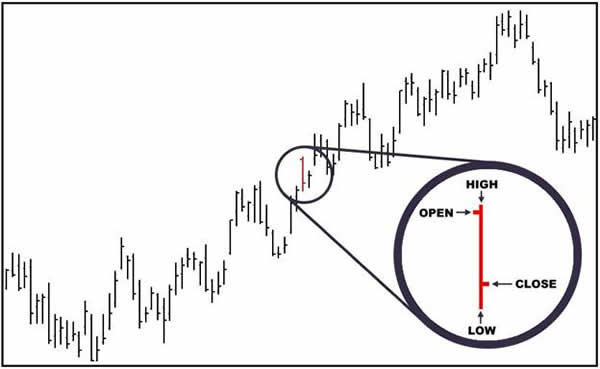
3. Candlestik Chart

Garis Trend (Trend Line)
Trend atau kecenderungan pergerakan dalam satu arah harga adalah salah satu istilah penting dalam melakukan analisis teknikal karena pada dasarnya analisis teknikal sendiri dikembangkan atas sebuah asumsi dasar yaitu harga bergerak dalam sebuah kecenderungan (trend) itu sendiri.
Secara sederhana, garis trend (trend line) adalah sebuah garis yang menghubungkan sedikitnya 2 titik harga atau lebih dan kemudian diperpanjang hingga beberapa periode ke depan.


Secara garis besar garis trend dapat dibagi menjadi 3 yaitu:
1. Trend meningkat /up trend (Bullish Market).

2. Trend menurun/down trend (Bearish Market)

3. Trend mendatar/horizontal trend (Sideways/Consolidation).

Support & Resistance
Support dan Resistance merupakan istilah penting dalam analisa teknikal yang berfungsi untuk mengindikasikan batas atas maupun batas bawah dari pergerakan harga.
Support adalah merupakan batas bawah/range di mana pada titik/range harga tersebut akan timbul minat beli yang lebih kuat dari pada minat jual. Kondisi ini secara otomatis mengakibatkan terjadinya kelebihan permintaan yang akan meningkatkan harga di pasar sehingga menghentikan trend penurunan harga.
Resistance adalah merupakan batas atas/range di mana pada titik/range harga tersebut akan timbul penguatan minat jual yang lebih besar dari pada minat beli yang secara otomatis akan timbul kelebihan penawaran yang akan mengakibatkan turunnya harga di pasar sehingga menghentikan kenaikan harga.

Overbought & Oversold
Overbought merupakan situasi di mana pasar telah menjadi jenuh akan banyaknya permintaan sehingga permintaan semakin berkurang sementara penawaran semakin bertambah yang menyebabkan harga cenderung bergerak turun atau melemah.
Oversold merupakan situasi di mana pasar telah menjadi jenuh akan banyaknya penawaran sehingga penawaran semakin berkurang sementara permintaan semakin bertambah yang menyebabkan harga cenderung bergerak naik atau menguat.
Chart Pattern
Grafik nilai tukar mata uang mempunyai beberapa pola pergerakan yang dapat digunakan sebagai tanda perubahan suatu trend tertentu.
Pada dasarnya ada 2 golongan besar jenis pola yang mungkin terjadi yaitu:
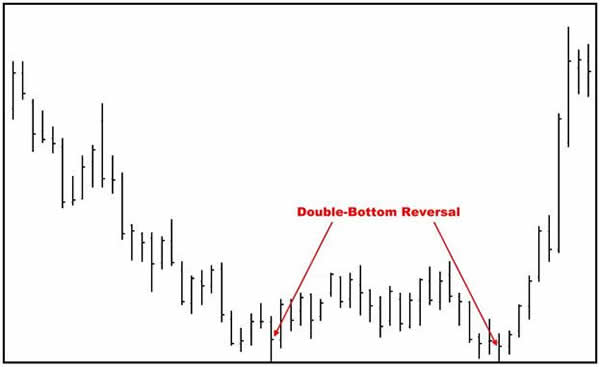
1. Reversal Pattern
Pola ini menunjukkan adanya perubahan trend, misalnya harga yang bergerak dalam uptrend berubah menjadi downtrend atau sebaliknya harga yang bergerak dalam downtrend berubah menjadi uptrend.
Reversal pattern mempunyai beberapa pola pergerakan sebagai berikut:
a. Double Tops

b. Double Bottoms
c. Head and Shoulders top reversal

d. Head and Shoulders bottom reversal

e. Falling Wedge

f. Rising Wedge

g. Diamond Pattern

2. Continuation Pattern
Pola ini menunjukkan adanya perubahan trend sementara yang dilanjutkan dengan perubahan ke trend awal yang dominan. Misalnya harga bergerak dalam uptrend kemudian berubah menjadi downtrend (retrace) dan meneruskan lagi uptrend sebelumnya atau sebaliknya.
Continuation pattern mempunyai beberapa pola pergerakan sebagai berikut:
a. Bullish Flags

b. Bearish Flags

c. Symmetrical Triangles or Pennants
d. Descending Triangle
e. Ascending Triangle

f. Cup and Saucer

Selain pola pergerakan chart seperti di atas, ada pula suatu pola unik yang disebut sebagai gap. Suatu chart membentuk gap apabila terdapat jarak atau celah antara 2 chart yang saling berdekatan yaitu jika nilai low dari chart sebelumnya lebih tinggi dari nilai high pada chart berikutnya atau sebaliknya atau jika nilai high dari chart sebelumnya lebih rendah dari low pada chart berikutnya.
Ada 3 bentuk utama dari gap yaitu:
a. Breakaway gap
b. Measuring gap
c. Exhausting gap

Indikator Teknikal
Indikator merupakan alat bantu utama yang digunakan dalam analisa chart. Secara garis besar ada 3 jenis indikator yaitu:
1. Price Momentum Indicator (Oscillator)
Jenis indikator ini digunakan untuk mengidentifikasi situasi oversold atau overbought. Momentum indikator juga digunakan untuk melihat apakah suatu trend masih akan berlanjut atau semakin melemah.
Contoh indikator:
- Stochastic Oscillator
- Relative Strength Index (RSI)
- CommodityChannel Index (CCI)
2. Trend Following Indicator
Indikator ini digunakan untuk mengidentifikasi awal dan akhir suatu trend atau kapan suatu trend akan berubah sehingga dapat diketahui kapan waktu terbaik untuk membuka dan menutup posisi.
Contoh indikator:
- Moving Average (MA)
- Moving Average Convergence - Divergence (MACD)
- Directional Movements Index (DMI)
- Parabolic SAR
3. Volatility Indicator
Indikator ini digunakan untuk melihat kekuatan pasar yang dilihat dari fluktuasi harga dalam satu periode waktu tertentu. Pasar dikatakan memiliki volatility yang tinggi jika pergerakan harga berlangsung naik turun secara tajam atau sangat fluktuatif di mana terjadi selisih harga yang besar antara harga tertinggi dan terendah.
Contoh indikator: - Bollinger Bands
Artikel Lain:
Technical Candlestick
The Art of Candlestick Charting
Using Indicator to Identify Trends
Support and Resistance

No comments:
Post a Comment